The DevOps Odyssey, Part 7: Observability on a Budget — Grafana, Loki, and Prometheus on OCI Free Tier
originally posted at LinkedIn at December 22, 2025
In Part 6, I closed the CI/CD loop with automatic image tagging and deployment updates.
Now, in Part 7, I’m adding the missing piece: observability. Without metrics and logs, you’re flying blind. But observability stacks are notoriously resource-hungry. The journey here was interesting: I started with default Helm chart resource settings, got everything working smoothly, then systematically tuned it down to prove it could run on minimal resources—all while keeping everything GitOps-managed.

Why Observability Matters
You can’t fix what you can’t see. When an app goes down or performance degrades, you need answers fast:
- What happened? — Logs tell the story.
- When did it happen? — Metrics show the timeline.
- Why did it happen? — Dashboards connect the dots.
But traditional monitoring stacks are heavy. Prometheus alone can consume gigabytes of memory. Grafana needs persistent storage. Loki wants disk space for log retention.
My approach was pragmatic: start with default settings to get everything working, then systematically optimize down. I’m running on OCI’s free tier with 16GB RAM and 3 CPU cores—plenty of headroom. But I wanted to prove the stack could run on much less, so I tuned everything down to minimal resource footprints while maintaining functionality.
The Stack: Grafana, Loki, Prometheus, and Alloy
I chose a modern observability stack that’s both powerful and lightweight:
- Prometheus — Time-series metrics database
- Grafana — Visualization and dashboards
- Loki — Log aggregation (like Prometheus, but for logs)
- Alloy — OpenTelemetry-compatible collector (replaces Fluent Bit)
Why Alloy over Fluent Bit? Alloy is Grafana’s modern answer to log collection. It’s written in Go, has native Kubernetes service discovery, and integrates seamlessly with both Loki and Prometheus. Plus, it’s more resource-efficient than traditional log shippers.
Architecture: GitOps-First, Resource-Conscious
Everything is deployed via Argo CD Applications—no Helm installs, no manual kubectl commands. Each component lives in its own directory with its own application.yaml:
infra/monitoring/
├── prometheus-grafana/
│   ├── application.yaml
│   └── values.yaml
├── loki/
│   ├── application.yaml
│   └── values.yaml
├── alloy/
│   ├── application.yaml
│   └── values.yaml
└── shared/
    ├── application.yaml
    ├── grafana-github-oauth-secret.sealed-secret.yaml
    └── ghcr-token.sealed-secret.yaml
The shared/ folder contains secrets and other resources that multiple components need—like the GitHub OAuth secret for Grafana login and the GHCR token for pulling container images. Each component is deployed as a separate Argo CD Application, referencing external Helm charts directly from their repositories.
Deploying Prometheus and Grafana
I’m using the kube-prometheus-stack Helm chart, which bundles Prometheus, Grafana, and Alertmanager.
Starting point: I initially deployed with default Helm chart resource settings and longer retention periods. Everything worked smoothly—Prometheus was scraping every 15 seconds, retaining 15 days of data, Grafana had plenty of headroom, and Loki was storing weeks of logs.
The optimization journey: Then I systematically tuned everything down to prove it could run on minimal resources:
# prometheus-grafana/values.yaml
prometheus:
  enabled: true
  prometheusSpec:
    retention: 5d  # Reduced from 15d to save memory
    storageSpec:
      emptyDir: {}  # Ephemeral storage—data resets on restart
      # Why no database? With 5-day retention, Prometheus keeps everything in memory
      # and on local disk. No need for PostgreSQL or external storage. This works
      # perfectly for demo/lab environments where data loss on restart is acceptable.
    resources:
      requests:
        memory: 256Mi  # Reduced from 1Gi
        cpu: 100m      # Reduced from 500m
      limits:
        memory: 512Mi  # Reduced from 4Gi
        cpu: 200m      # Reduced from 2000m
    scrapeInterval: 60s  # Increased from 30s to reduce memory pressure
    evaluationInterval: 60s

grafana:
  enabled: true
  resources:
    requests:
      memory: 128Mi  # Reduced from 256Mi
      cpu: 50m       # Reduced from 100m
    limits:
      memory: 512Mi  # Reduced from 1Gi
      cpu: 100m      # Reduced from 200m
  ingress:
    enabled: true
    ingressClassName: traefik
    hosts:
      - janusc.duckdns.org
    path: /grafana
The key insight: retention period is the biggest lever. Reducing from 15 days to 5 days cut Prometheus memory usage by about 70%. Less frequent scraping (60s instead of 30s) further reduced memory pressure without losing meaningful visibility.
Deploying Loki for Log Aggregation
Loki is Grafana’s log aggregation system. It’s designed to be Prometheus-like: same query language (LogQL), same labeling model, same efficiency. For a single-node setup, I use Loki’s SingleBinary mode:
Initial deployment: Started with 7-day retention and default resources. Loki was using about 600Mi of memory and running smoothly.
Optimization: Reduced retention to 5 days and tuned resources down:
# loki/values.yaml
deploymentMode: SingleBinary

singleBinary:
  replicas: 1
  resources:
    requests:
      memory: 256Mi  # Reduced from 512Mi
      cpu: 50m       # Reduced from 100m
    limits:
      memory: 512Mi  # Reduced from 1Gi
      cpu: 100m      # Reduced from 200m

persistence:
  enabled: true
  size: 2Gi  # Small disk for short retention

loki:
  limits_config:
    retention_period: 5d  # Reduced from 7d to match Prometheus
  schema_config:
    configs:
      - from: "2024-01-01"
        store: tsdb
        object_store: filesystem
        schema: v13
The retention period is critical. With 5 days of retention, Loki uses about 300-400Mi of memory. Bump it to 30 days, and you’ll need 2GB+. For a demo environment, 5 days is plenty—and it still gives you a full week of log history.
Deploying Alloy for Log Collection
Alloy runs as a DaemonSet, collecting logs from every pod in the cluster. It forwards logs to Loki and metrics to Prometheus. The configuration is written in HCL (HashiCorp Configuration Language):
Initial setup: Alloy ran with default resources and worked perfectly from day one. It’s lightweight by design.
Optimization: Tuned down to minimal resources:
# alloy/values.yaml
alloy:
  configMap:
    create: true
    content: |
      prometheus.remote_write "prometheus" {
        endpoint {
          url = "http://prometheus-grafana-kube-pr-prometheus:9090/api/v1/write"
        }
      }

      loki.write "loki" {
        endpoint {
          url = "http://loki:3100/loki/api/v1/push"
        }
      }

      discovery.kubernetes "pods_logs" {
        role = "pod"
      }

      loki.source.kubernetes "kubernetes" {
        targets = discovery.kubernetes.pods_logs.targets
        forward_to = [loki.relabel.add_labels.receiver]
      }

      loki.relabel "add_labels" {
        forward_to = [loki.write.loki.receiver]

        // Extract pod name for easier filtering
        rule {
          source_labels = ["instance"]
          regex        = "^[^/]+/([^:]+):.*$"
          target_label = "pod_name"
          replacement  = "$1"
        }

        // Extract service name from pod name pattern
        rule {
          source_labels = ["pod_name"]
          regex        = "^([a-z-]+(?:-[a-z]+)?)-[a-z0-9-]+$"
          target_label = "service_name"
          replacement  = "$1"
        }
      }
  resources:
    requests:
      memory: 64Mi  # Already minimal
      cpu: 25m      # Already minimal
    limits:
      memory: 256Mi  # Reduced from 512Mi
      cpu: 100m     # Reduced from 200m
The relabeling rules are crucial. By default, Alloy labels logs with the full instance path (namespace/pod-name:container). The relabeling extracts clean pod_name and service_name labels, making it easy to filter logs in Grafana by just the pod or service name.
GitHub OAuth for Grafana
Like Argo CD, Grafana supports GitHub OAuth. I configured it using the same OAuth app and sealed secrets pattern:
# prometheus-grafana/values.yaml
grafana:
  admin:
    existingSecret: grafana-github-oauth-secret
    userKey: admin-user
  extraSecretMounts:
    - name: grafana-github-oauth
      secretName: grafana-github-oauth-secret
      mountPath: /etc/secrets/grafana-github-oauth
  grafana.ini:
    users:
      admin_user: januschung
    auth.github:
      enabled: true
      allow_sign_up: true
      client_id: $__file{/etc/secrets/grafana-github-oauth/client_id}
      client_secret: $__file{/etc/secrets/grafana-github-oauth/client_secret}
      scopes: read:org,user:email
      auto_assign_org_role: Viewer
      role_attribute_path: login=='januschung' && 'Admin' || 'Viewer'
      allow_assign_grafana_admin: true
The $__file{} syntax lets Grafana read secrets from mounted files—a cleaner approach than environment variables for grafana.ini configuration.
Resource Optimization: The Journey and The Numbers
Starting point (default Helm chart settings):
- Prometheus: 1Gi request, 4Gi limit, 15-day retention, 30s scrape interval
- Grafana: 256Mi request, 1Gi limit
- Loki: 512Mi request, 1Gi limit, 7-day retention
- Alloy: 128Mi request, 512Mi limit
Everything ran smoothly with plenty of headroom on my 16GB VM. But I wanted to prove it could run on much less.
Optimized configuration (minimal resources):
| Component | Memory Request | Memory Limit | CPU Request | CPU Limit | Key Changes |
|---|---|---|---|---|---|
| Prometheus | 256Mi | 512Mi | 100m | 200m | 5d retention, 60s scrape |
| Grafana | 128Mi | 512Mi | 50m | 100m | Reduced limits |
| Loki | 256Mi | 512Mi | 50m | 100m | 5d retention |
| Alloy | 64Mi | 256Mi | 25m | 100m | Minimal footprint |
| Total | 704Mi | 1.7Gi | 225m | 500m | ~70% reduction |
On my 16GB VM, this leaves 14GB+ for the OS, K3s, Argo CD, and application workloads. But the same configuration would work on a 2GB VM—it’s tight, but it works.
The key optimizations that made this possible:
- Short retention (5 days) — Reduced memory usage by 60-80% compared to 15-30 day retention
- Less frequent scraping (60s) — Reduced Prometheus memory pressure by ~40%
- Ephemeral storage — No persistent volumes means no disk I/O overhead
- Single binary mode for Loki — No distributed overhead
- Right-sized limits — Started generous, tuned down based on actual usage
Why in-memory and no database? With 5-day retention, both Prometheus and Loki can keep all their data in memory and on local filesystem. Prometheus uses its built-in TSDB (time-series database) stored in emptyDir, and Loki uses filesystem storage. There’s no need for PostgreSQL, MySQL, or any external database. This works perfectly for demo and lab environments where:
- Data loss on pod restart is acceptable
- Historical data beyond 5 days isn’t critical
- Simplicity and resource efficiency matter more than long-term persistence
For production with longer retention, you’d want persistent volumes and potentially external object storage (S3, GCS) for Loki. But for a GitOps-managed lab environment, in-memory is the right choice.
Data Source Auto-Provisioning
Grafana needs to know where Prometheus and Loki are. Instead of configuring them manually, I define datasources in values.yaml:
grafana:
  datasources:
    datasources.yaml:
      apiVersion: 1
      datasources:
        - name: Prometheus
          type: prometheus
          url: http://prometheus-grafana-kube-pr-prometheus:9090
          access: proxy
        - name: Loki
          type: loki
          url: http://loki:3100
          access: proxy
Grafana automatically provisions these datasources on startup, so you can start querying immediately after deployment.
Everything in code, nothing in the UI. This is a core GitOps principle: all configuration lives in Git. Datasources, dashboards, alert rules—everything is defined in YAML and version-controlled. No manual clicks in the Grafana UI that would drift from the declared state. When you need to change a dashboard or add an alert, you edit the code, commit, and Argo CD syncs it automatically. This keeps the monitoring stack as declarative and reproducible as the rest of the infrastructure.
Operational Reality: What You Get
Once deployed, you have:
- Prometheus scraping metrics from every pod every 60 seconds
- Loki aggregating logs from all containers via Alloy
- Grafana with pre-configured datasources and GitHub OAuth
- Alloy running on every node, forwarding logs and metrics
In Grafana’s Explore view, you can:
- Query logs by pod name:
{pod_name="job-winner-backend"} - Query logs by service:
{service_name="photo-show"} - Query metrics:
rate(container_cpu_usage_seconds_total[5m]) - Build dashboards for any application
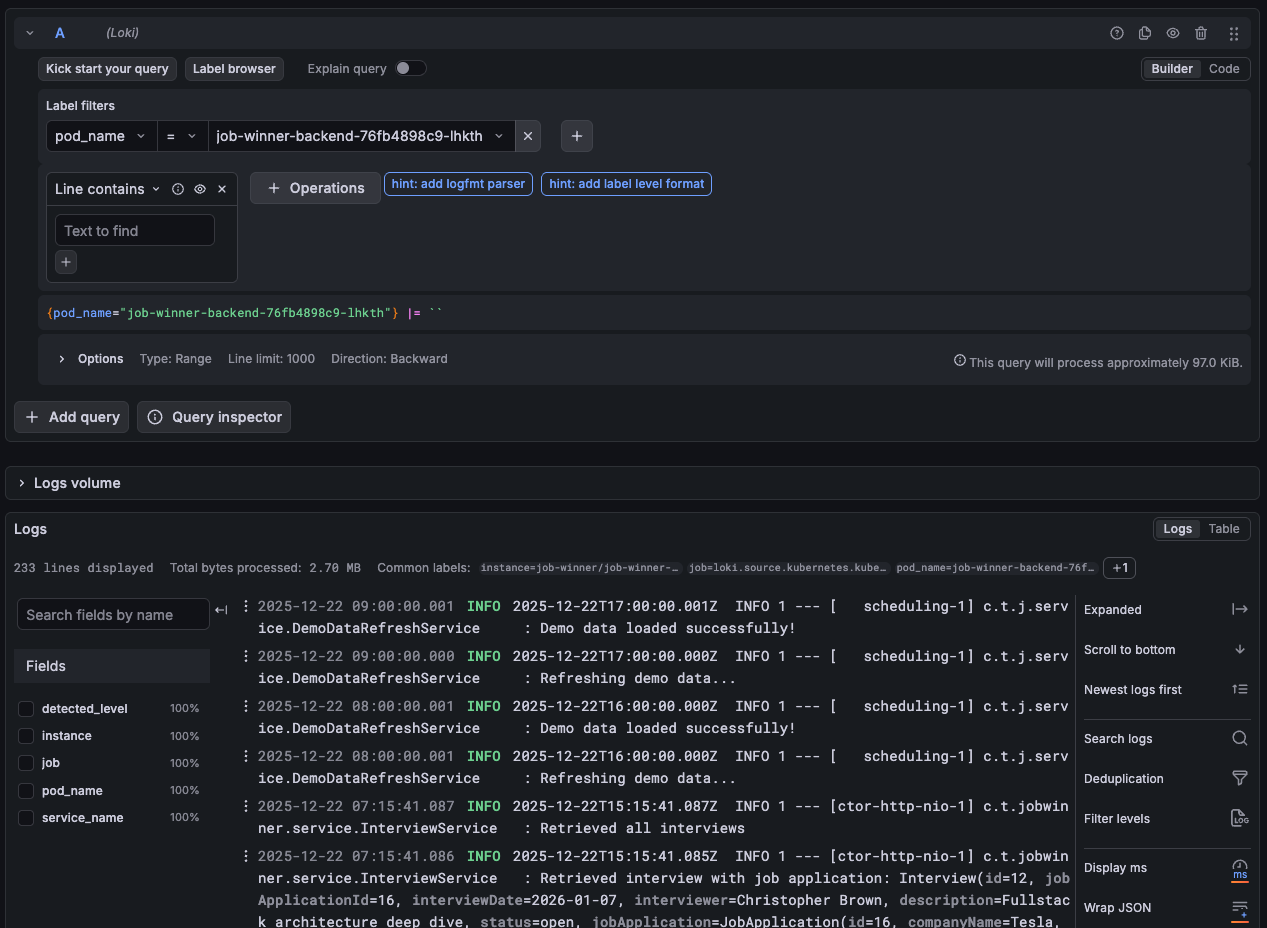 Grafana Explore view with log queries filtered by pod_name
Everything is GitOps-managed. Change a retention period? Edit values.yaml and commit. Argo CD syncs it automatically.
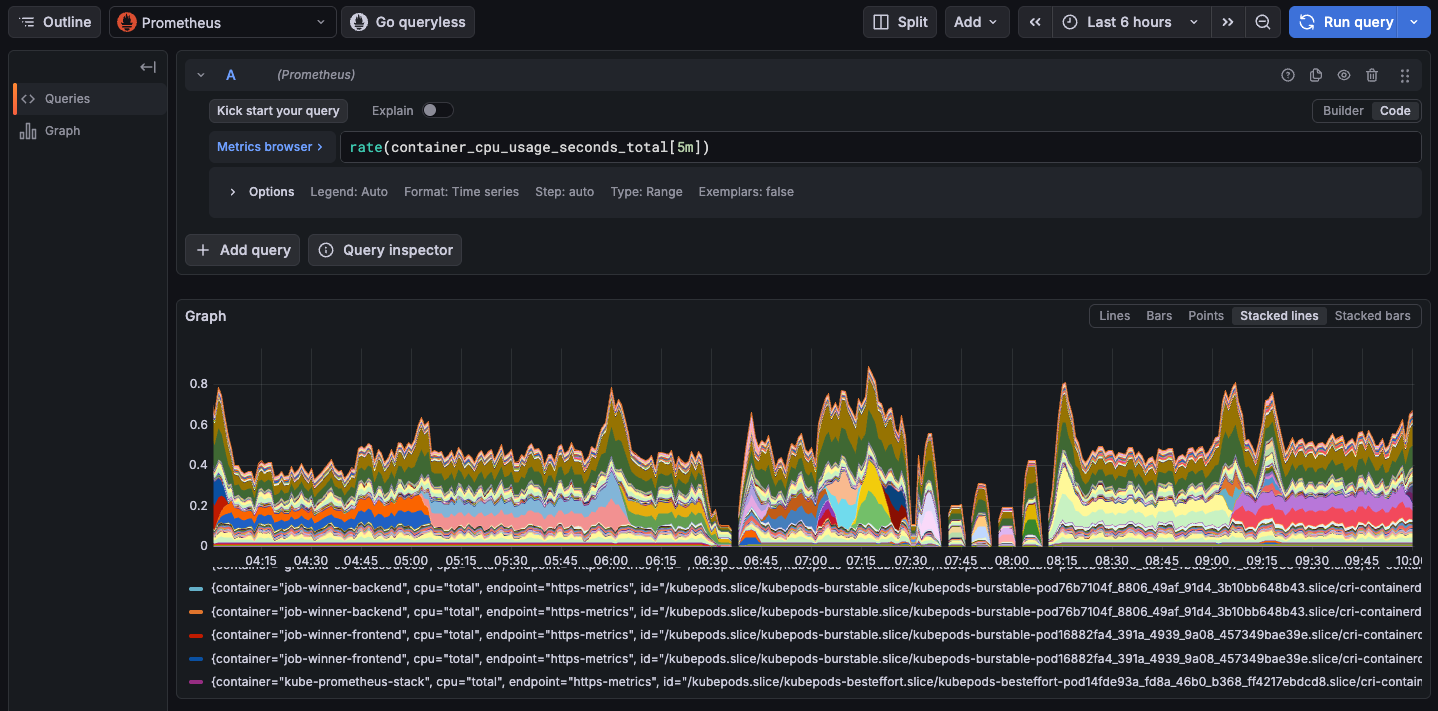 Example Grafana dashboard displaying CPU usage for every containers
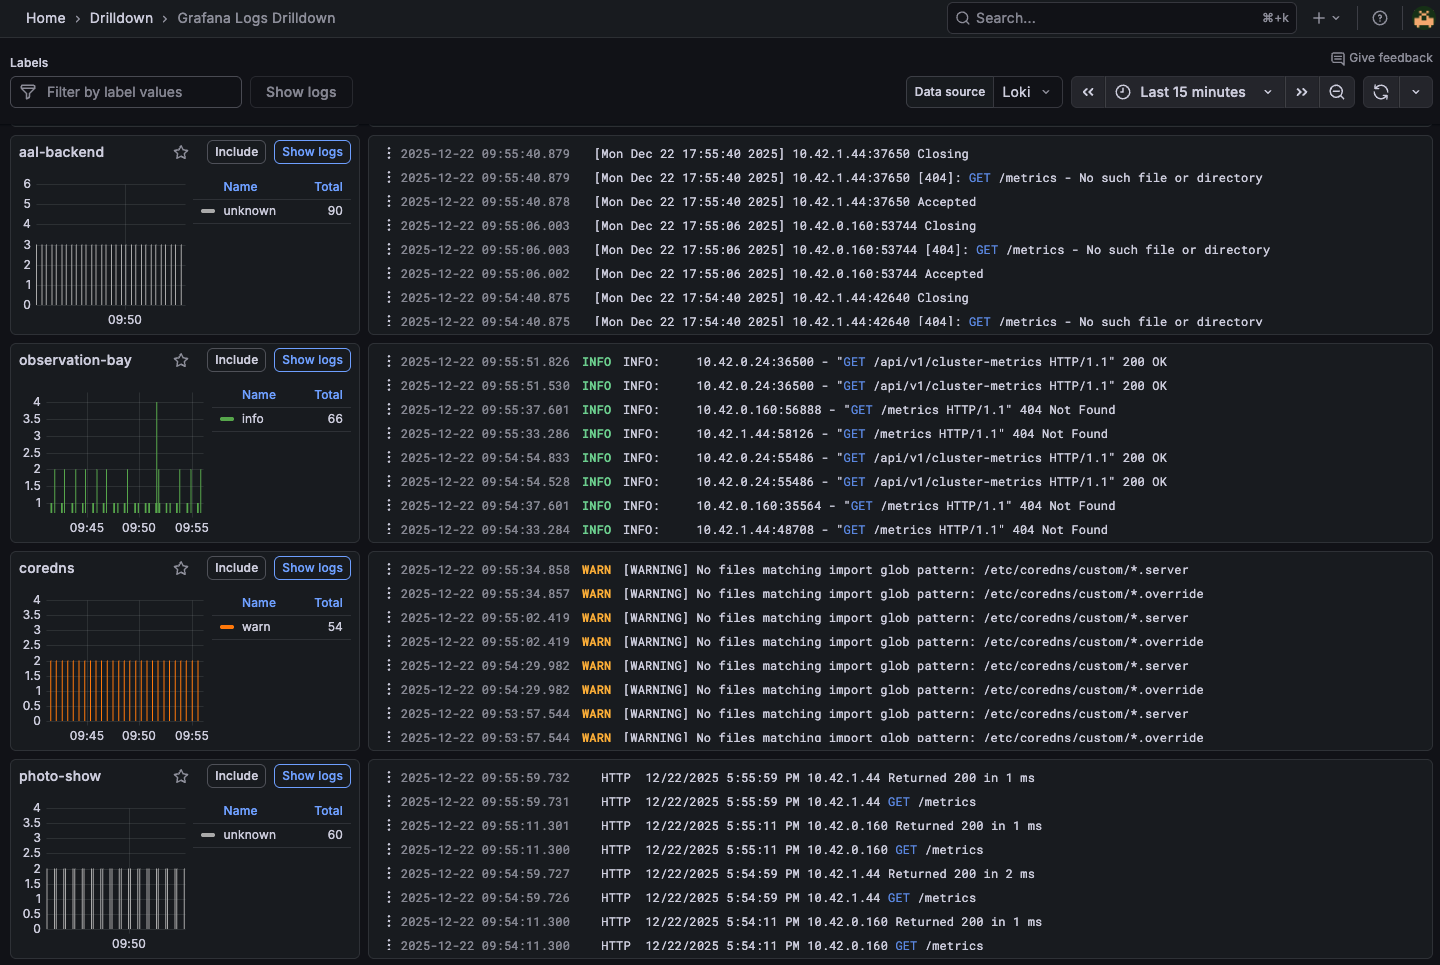 Handy Drilldown view to show the latest log entries across the cluster
Lessons Learned
1. Retention is the biggest lever. Reducing retention from 30 days to 5 days cut memory usage by 70%. For demo environments, short retention is fine.
2. In-memory storage works for short retention. With 5-day retention, Prometheus and Loki don’t need external databases. Everything lives in memory and local filesystem. This eliminates database overhead, simplifies the stack, and reduces resource usage. For production with longer retention, you’d want persistent volumes and object storage—but for demos, in-memory is perfect.
3. Alloy is simpler than Fluent Bit. Native Kubernetes discovery, better resource efficiency, and cleaner configuration.
4. GitOps makes experimentation safe. Try different retention periods, scrape intervals, or resource limits. If something breaks, revert the commit.
5. Shared resources need a home. The shared/ folder pattern keeps secrets and ConfigMaps organized and version-controlled.
Final Takeaways
Observability doesn’t have to be expensive. The journey from generous resources to optimized minimal footprint taught me:
- Start with defaults, optimize later — Get everything working first, then tune down. It’s easier to reduce resources than to debug why something won’t start.
- Retention is the biggest lever — Reducing retention from 15-30 days to 5 days cuts memory usage by 60-80%. For demos and labs, 5 days is plenty.
- Right-sized resources matter — Prometheus with 4Gi limit was overkill. 512Mi works fine for 5-day retention.
- GitOps makes experimentation safe — Try different retention periods, scrape intervals, or resource limits. If something breaks, revert the commit.
- Modern tooling is efficient — Alloy over Fluent Bit, Loki over ELK. The new generation of observability tools is built for resource efficiency.
This setup proves you can run production-grade observability on free-tier resources. With 16GB RAM, it’s comfortable. With 2GB RAM, it’s tight but workable. The same configuration scales up or down based on your constraints.
From zero infrastructure to full observability—the odyssey continues.